Mathematical
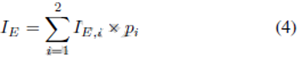
Modeling of Human Performance and Cognition
|
|
[Features] |
The
goal of this document is to summarize and integrate all mathematical modeling
work that quantifies the different aspects and components of human cognition
and performance. It will also serve as a learning material platform for new
users of mathematical modeling of human performance.
1. Unique Features of
Mathematical Modeling of Human Performance and Cognition
Mathematical
equations can predict, quantify and analyze human performance, workload, brain
waves, and other indexes of human behavior in a rigorous way. Compared with
computer simulation,
1) Mathematical models and equations of human
behavior clearly quantify and extract the mechanisms of human behavior by clear
quantifications of the relationships of variables including the relationship
between the input and output of each equation. Users of these mathematical
models will be much easier to understand and extract the relationships among
variables than reading computer codes.
2) Mathematical models and equations of
human behavior can be relatively easily to be edited, modified, improved, and
integrated together to develop new mathematical equations.
3) Mathematical models and equations of
human behavior and performance can be relatively easily be implemented in
different programming languages and be imbedded in different intelligent
systems to work together with system design.
4) Mathematical models and equations can
lead to analytical solutions, which are more accurate than simulation results.
5) There are mathematical models and
equations quantifying the entire human cognition system (See equations in the
entire network) which is another unique feature of the mathematical modeling
approach.
6) There are mathematical models and
equations can be proved by mathematics derivation directly with no need to be
verified by empirical data (See Equations in Wu, C., Berman, M., & Liu, Y.,
2010).
2. Usage of Mathematical Models and
Equations in this Summary Webpage
The
equations summarized here can also serve as an index page and a guideline tool
for modelers who can:
1) Use
those mathematical models to quantify and predict new phenomena and tasks in
human performance
2) Add and develop new equations and
mathematical models to quantify new components of human cognition and
performance to further grow with the framework of the Queuing Network-Model
Human Processor (QN-MHP)
3) To be used and imbedded in different
intelligent systems and tool design for human performance and behavior
predictions
1) How to build
and verify models of human performance (General Descriptions) (Wu, 2016) and YouTube
Video
2) How to
build mathematical models (e.g., Page 9-10) (Wu & Liu, 2008a): Free tutorial video please email Dr.Wu changxu.wu@gmail.com
3) How to
integrate and build new mathematical models in human performance modeling
(Zhang & Wu, 2017)
4) To become a member (user or contributor)
of mathematical modeling group in human performance modeling, please email to changxu.wu@gmailcom (Please list your full name and
institution/company name), we will send you recent updates, new modeling work,
and new tutorials. All of them are free.
3. Human Machine System Design
Tools based on the Equations on this Page [Link]
4. Mathematical Equations in the
Queuing Network-Model Human Processors (QN-MHP) as the Framework
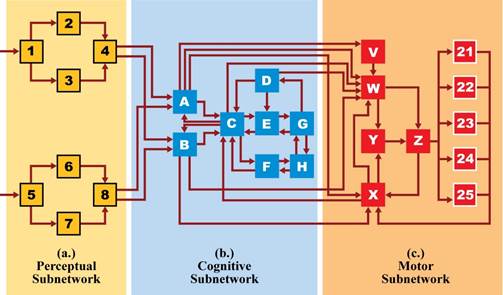
The
General Structure of Queuing Network-Model Human Processor (QN-MHP)
|
(a.) Perceptual Subnetwork |
|
(b.) Cognitive Subnetwork |
|
(c.) Motor Subnetwork |
|
1. Common visual processing 2. Visual recognition 3. Visual location 4. Visual recognition and location integration 5. Common auditory processing 6. Auditory recognition 7. Auditory location 8. Auditory recognition and location integration |
|
A. Visuospatial sketchpad B. Phonological loop C. Central executive D. Long-term procedural memory E. Performance monitor F. Complex cognitive function G. Goal initiation H. Long-term declarative & spatial memory |
|
V. Sensorimotor integration W. Motor program retrieval X. Feedback information collection Y. Motor program assembling and error detecting Z. Sending information to body parts 21-25 etc.: Body parts: eye, mouth, left hand,
right hand, foot |
Server Information Processing Time and
Information Processing Capacities
|
Server Name |
Processing Timea: Exponential
Distribution (Mean, Min) (ms) |
Capacity (Entitiesa) |
|
Server Name |
Processing Time: Exponential Distribution
(Mean, Min) (ms) |
Capacity (Entitiesb) |
|
1 |
Exp
(42, 25) |
4 |
|
5 |
Exp
(42, 25) |
2 |
|
2 |
Exp (42, 25) |
4 |
|
6 |
Exp (42, 25) |
1 |
|
3 |
Exp (42, 25) |
4 |
|
7 |
Exp (42, 25) |
1 |
|
4 |
Exp (42, 25) |
5 |
|
8 |
Exp (42, 25) |
1 |
|
A |
Exp (18, 6) |
4 |
|
E |
Exp (18, 6) |
Infinitec |
|
B |
Exp (18, 6) |
4 |
|
F |
Exp (18, 6) per cycle |
1 |
|
C |
Exp (18, 6) |
3 |
|
G |
Exp (18, 6) |
Infinitec |
|
D |
Exp (18, 6)e |
Infinite |
|
H |
Exp (18, 6)e |
Infinite |
|
V |
Exp (24, 10) |
Infinitec |
|
X |
Exp (24, 10) |
Infinitec |
|
W |
Exp (24, 10) |
1c |
|
21 (Eye Motor) |
Saccade and Fixation Timed |
1 |
|
Y |
Exp (24, 10) |
2 |
|
22
(Mouth) |
As a function of number of syllables (Voice key closure time: 100 ms, Wu & Liu, 2008a) |
1 |
|
Z |
Exp (24, 10) |
2 |
|
23
(Right Hand & Right Arm) |
Arm and hand movement time, see Fitts's Law; Finger movement
time, see (Wu & Liu, 2008b) |
1 (If one movement per time) |
|
25 (Right Foot) |
Foot movement time, see (Zhang, Wu, & Wan, 2016;
Zhao & Wu, 2013; Zhao, Wu, & Qiao, 2013) |
1 (If one movement per time) |
|
24
(Left Hand & Left Arm) |
Arm and hand movement time, see Fitts's Law; Finger movement
time, see (Wu & Liu, 2008b) |
1 (If one movement per time) |
|
26 (Left Foot) |
Foot movement time, see (Zhang et al., 2016; Zhao &
Wu, 2013; Zhao et al., 2013) |
1 (If one movement per time) |
|
27 (Head), 28 (Body),
etc. |
Head, body movement time etc.c |
1 (If one movement per time) |
a.
Processing speed and capacities were set based on Model Human Processor (Card,
et al., 1983), Wu et al (2008-2017), and Jacobson (1999).
b. Entity is defined as the smallest
information processing unit in a given task. For example, in a typing task, one
letter is an entity. In a speech warning responding task, each short word can
be regarded as one entity. For long words in speech warning, each syllable can
be represented as one entity.
c. Needs further modeling work and investigation.
d. See Model Human Processor (Card, et al.,
1983).
e. Also depends on level of information
retrieval (e.g., familiarity and number of time of retrieval).
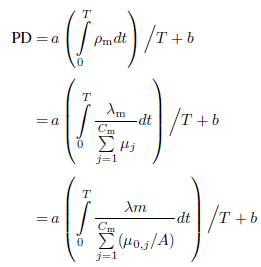
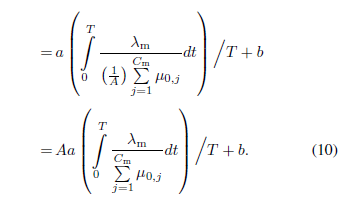
Equation
Set EN-1: Mental workload modeling measured by NASA-TLX: Equation (10-12) (Wu &
Liu, 2007)
|
Variables |
||
|
PD |
Physical Demand |
How much physical activity was required? Was
the task easy or demanding, slack or strenuous? |
|
TD |
Temporal Demand |
How much time pressure did you feel due to the
pace at which the tasks or task elements occurred? Was the pace slow or
rapid? |
|
EF |
Effort |
How hard did you have to work (mentally and
physically) to accomplish your level of performance? |
|
PE |
Performance |
How successful were you in performing the
task? How satisfied were you with your performance? |
|
FR |
Frustration |
How irritated, stressed, and annoyed versus
content, relaxed, and complacent did you feel during the task? |
|
MD |
Mental Demand |
How much mental and perceptual activity was
required? Was the task easy or demanding, simple or complex? |
|
A |
A factor of aging (A ≥ 1) |
The value of A is
directly proportional to age, set based on literature |
|
|
Arrival rate |
The arrival rate of the
subnetwork i |
|
|
Original processing
speed |
The original processing
speed of server j for the young
adults in QN-MHP |
|
|
Number of servers |
The total number of
servers in the subnetwork m |
|
T |
Total time of a trial |
The
total task time of each trial |
|
a |
Constant |
The constants in
representing the direct proportional relation between the averaged
utilizations and the subjective responses (a > 0), see the published work |
|
b |
Constant |
Same above |
Equation
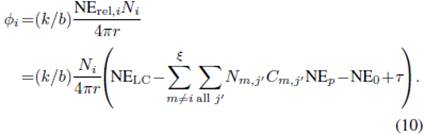
Set EN-2: Mental workload modeling measured by P300 amplitude and latency:
Equation (10-11) (Wu, Liu,
& Quinn-Walsh, 2008)
![]()
|
Variables |
|
|
|
|
Amplitude of the ERP
potential P300 |
|
|
Li |
Latency of the P300 |
|
|
k |
Constant |
A constant in this
relationship I = kN. |
|
b |
Constant |
A constant in this
inverse relationship |
|
NE |
Amount of NE |
Modeling NE (norepinephrine) in Synaptic Transmission |
|
|
Number |
Number of information
entities |
|
|
Number |
Number of information
entities of other tasks concurrently processed in server j |
|
|
Number |
Number of processing cycles
for each of those entities at server j |
|
|
A random factor |
Normally distributed
random factor with mean being equal to zero |
|
r |
Distance |
Distance from the
electrical field point (the location where NE is released) to locations of
the electrodes on the scalp |
|
|
Processing times |
Processing times of task
i at the perceptual subnetwork, at
Server A or B, and at Servers C and E, respectively |
Equation
Set EN-3: Bold signal in fMRI modeling: Equation (27) (Wu &
Liu, 2008a)
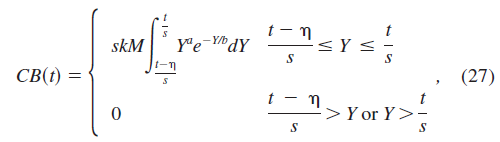
|
Variables |
|
|
|
CB(t) |
The integrated BOLD
signal |
Modeling of BOLD signal
and its percentage of change: The integrated BOLD (blood oxygen level
dependent) signal |
|
s |
Latency scale |
|
|
M |
Magnitude scale |
|
|
k,a,b |
Parameters |
k, a, and b come from
the equations of Cohen (1997) and Anderson et al. (2003), determined by the
properties of the brain regions with certain fMRI measurement techniques |
|
t |
The duration of each
trial |
Modeling of BOLD Signal
and Its Percentage of Change |
|
|
The length of time being
occupied at a server |
In queuing networks can
be quantified by Equation 28 (Gross & Harris, 1998): |
Equation
Set EN-4: Entity route selections and skill acquisitions based on reinforcement
learning algorithms: Equation (9.7-9.8) (Wu, Berman,
& Liu, 2010)
![]()
|
Variables |
|
|
|
Processing speed of server i |
|
|
The minimal of processing time of server i after intensive practice |
|
|
The change of expected value of processing
time of server i from the beginning
to the end of the practice |
|
|
Learning rate of server i |
|
|
Number of entities processed by server i |
![]()
|
Variables |
|
|
|
|
Online Q value |
|
|
|
Maximum Q value |
Maximum Q value routing from server j to
next k server(s) |
|
|
Processing speed |
|
|
|
Discount parameter |
The discount parameter of routing to the
next server( |
|
|
Learning rate |
The learning rate of Q online learning( |
Equation
Set EN-5: Information processing speed and its variability changes in learning
process: Equation (6) (Wu &
Liu, 2008b)
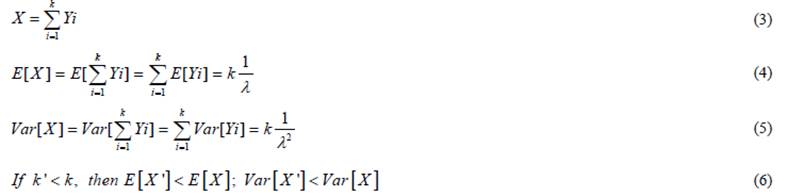
|
Variables |
|
|
|
X |
Summation of processing
time of servers (Y) |
|
|
Yi |
Processing time of
server i |
|
|
k |
Number of servers in the
route |
|
|
|
Arrival rates of entities/information |
|
Equation
Set EN-6: Modeling the expected utilization as the mental workload under the
time stress. Equation (2) (Cao &
Liu, 2015)
![]()
|
Variables |
|
|
|
a,b |
Parameter |
Parameters a and b are the constants in representing
the direct proportional relation between the averaged utilizations and the
subjective responses (a > 0) |
|
|
The average utilization of motor
subnetwork |
The score of PD reflects workload at the
motor component, and therefore, it is in direct proportion to the average
utilization of motor subnetwork |
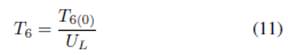
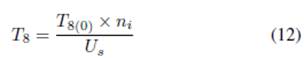
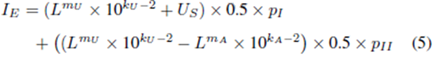
Equation Set EN-7: Modeling the response
time of speech warnings. Equation (11, 12, 13) (Zhang, Wu & Wan, 2016)
|
Variables |
Description |
|
Tk |
Notation of processing time of the
stimulus at Server k (k =1-8, A,B,C,F,H, W−Z) |
|
T6(0)and T8(0) |
The initial entity
processing time in Server 6 and Server 8, respectively |
|
UL |
The perceived urgency as
a function of warning loudness |
|
US |
The perceived urgency as
a function of signal world choice |
|
pi |
Notation of probability of a warning
stimulus traveling through a route i
(i=I or II) |
Perceptual Subnetwork
-Visual perceptual subnetwork:
Server
1. Equation Set VP-1: Eye movement modeling in textual information perception:
Equation (12) (Wu &
Liu, 2008b)
![]()
|
Variables |
Sources |
|
|
E(FC) |
The expected position of the first
character in each chunk |
Calculation
of the Expected Position of the First Character i |
|
E(FP) |
The expected position of the fixation
point |
|
|
|
The half-range of each chunk under
extensive practice condition |
Server
1. Equation Set VP-2: Eye movement modeling in picture information perception:
Equation (3) (Lim &
Liu, 2009)
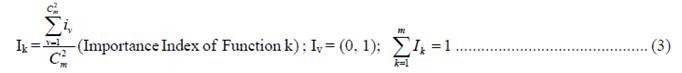
|
Variables |
|
|
|
|
Importance index of function k |
The relatively important function can be
given a value 1, and a value 0 is given to the other. The importance index of
function k can be calculated. |
|
|
The importance value for function k |
The importance value for function k
obtained from each pair-wise comparisons, either 1 or 0. |
Sever
3. Equation Set VP-3: Visual optical flow perception and speed perception:
Equation (1) (Zhao &
Wu, 2013)
|
Variables |
|
|
|
Perceived speed |
|
V |
Actual speed |
|
|
The current texture density |
|
|
The texture density in the last driving
scenario |
|
|
The eye height in the last driving
scenario |
|
|
The current eye height |
|
|
two constant parameters |
Sever
4. Equation Set VP-4: Visual detection modeling with detection distance and
image matrix: Equation (12) (Bi,
Tsimhoni, & Liu, 2009)
![]()
|
Variables |
|
|
|
RPOT |
Square root of the number of pixels on a
target |
|
|
f |
Focal length |
|
|
S |
Size of the area of a target object. |
|
|
D |
Distance of the image
forming |
|
-Auditory perceptual subnetwork:
Sever
6. Equation Set AP-1: Modeling the effect of loudness on speech
warning perception: Equation
(1, 11) (Zhang,
Wu, & Wan, 2016)
![]()
|
Variables |
|
|
|
|
The perceived urgency |
Modeling the relationship between loudness
and perceived urgency |
|
|
Constants |
The relationship between intensity and
perceived urgency was quantified: |
|
|
Random factors |
distributed random factors following
distribution [0, 0.7] |
|
L |
Loudness level |
|
Variables |
|
|
|
The effect of loudness on reaction time |
|
|
The initial entity processing time in
Server 6 |
|
|
The effect of loudness on perceived
urgency |
Sever
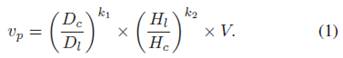
8. Equation Set AP-2: Modeling the effect of signal word on speech
warning perception: Equation
(12) (Zhang, Wu, & Wan, 2016)
|
Variables |
|
|
|
The effect of signal word choice on
reaction time |
|
|
The entity processing time in Server 8 |
|
|
The urgency level expressed by the initial
words |
|
|
The number of words in the ith speech warning |
Cognitive Subnetwork
-Server
B:
Equation Set C-1: Modeling of optimal
chunking of textual information: Equation (22) (Wu & Liu, 2008b)
![]()
|
Variables |
Description |
|
Z |
Objective
function of task completion time |
|
|
Overall
duration of processing each chunk at servers after server B |
|
N |
Total
number of entities processed |
|
x |
Chunk
size |
|
|
Rate
of retrieval failure at server B |
|
R |
Average duration to correct an error caused by a wrongly processed
entity or character |
Equation
Set C-2: Modeling of memory decay of speech information: Equation (7) ( Zhang, Wu, & Wan, 2016)
![]()
|
Variables |
Description |
|
|
The
probability of memory decay |
|
|
Lead
time of a speech warning |
Equation
Set C-3: Modeling the probability of route choice in reinforcement learning of
the speech warnings: Equation (4-5) ( Zhang, Wu, & Wan, 2016)
|
Variables |
|
|
|
The
route choice error rate |
|
|
The
error rate when a speech warning travels via route i |
|
|
The
probability of a speech warning entity processed via route i |
|
Variables |
|
|
|
The
error rate of route choice |
|
L |
Loudness
level in dB |
|
|
Perceived
urgency level with different signal word choice |
|
|
Parameters
to quantify the power law of perceived urgency and loudness |
|
|
Parameters
to quantify the power law of perceived annoyance and loudness |
|
pI, pII |
Probabilities
of choosing route I (the shorter route) and route II (the longer route) |
-Server C:
Equation Set C-4: Inhibiting incompatible
responses modeling: Equation (4-6) (Wu &
Liu, 2008a)
|
Variables |
|
|
T2,C-comp and T2,F-comp, |
Processing
times of Server C and F in the compatible conditions |
|
T2,C-incomp and T2,F-incomp |
Processing times of Server
C and F in the incompatible conditions |
|
SOA (stimulus onset
asynchrony) |
The
delay between the presentation of the stimuli of T1 and T2 |
|
Tk |
Processing time at server k (k=AP,
VP, A, B, C, F, W, Y, Z, X) |
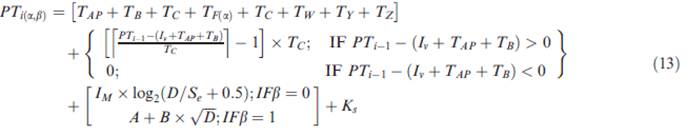
Equation Set C-5: Dual task interference
modeling: Equation (8-9) (Lin &
Wu, 2012)
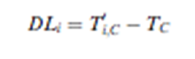
|
Variables |
Description |
Sources |
|
|
|
DLi |
Delay time |
|
||
|
Ti,C |
The entity processing time needed at
Server C |
|
||
|
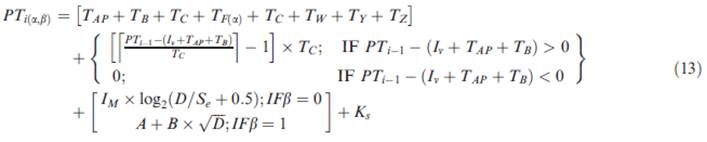
PTi-1 |
Time lapse for the previous key to be
pressed |
|
||
|
Iv |
Inter stimulus interval |
|
||
|
Iv + TAP+ TB |
Time lapse for the entity of the on-going
stimulus to leave Server B |
|
||
|
PTi-1-(Iv +TAP+TB) |
The least duration that the current stimulus
needs to wait at Server C |
|
||
|
TC |
Cycle time at Server C |
|
||
-Server
E:
Equation
Set C-6: Background noise in motor control: Equation (15) (Lin &
Wu, 2012)

|
Variables |
|
|
|
|
The extent of SDN added with muscle
activation level u; |
Modelling baseline errors in numerical
typing |
|
|
Experimental constants |
Modelling baseline errors in numerical
typing |
|
u |
Muscle activation level |
Modelling baseline errors in numerical
typing |
|
c |
The extent of temporal noise |
c is the extent of TN which accumulates as
movement time increases |
|
I |
Interference index |
I was an interference index accounting for
the relative extent of the dual-task interference in background noise (CN). |
-Server F
Equation Set C-7: Choice reaction modeling
in multiple tasks: Equation (B16) (Wu & Liu, 2008a)
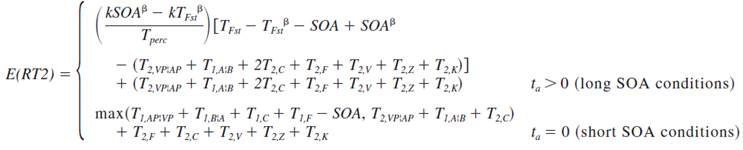
![]()
|
Variables |
|
|
|
E(RT2) |
Expected reaction time |
|
|
SOA |
Stimulus-onset asynchrony |
The time difference between the onset of
the two stimuli from two tasks |
|
Ti |
Processing time of servers see (Wu & Liu, 2008a) |
|
|
TFst |
|
|
Equation Set C-8: Modeling the effects of
response complexity (using a single finger or multiple fingers at the same
time): Equation (1-13) (Lin &
Wu, 2012)
|
Variables |
|
|
|
|
Response time to i th stimulus with a finger
strategy under an urgency condition |
|
|
|
Finger strategy |
|
|
i |
Response order |
|
|
T |
Processing time |
|
Equation Set C-9: Complex decision making
with value matrix: Equation (5) (Zhao &
Wu, 2013)
|
Variables |
|
|
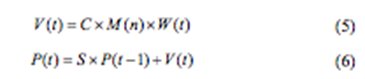
P(t) |
Speed
choice at time t |
|
V(t) |
Momentary
valence |
|
M(n) |
Human
subjective attribute matrix |
|
W(t) |
Attention weight matrix |
|
S |
Feedback matrix |
Equation Set C-10: Perceived risk modeling:
Equation (5) (Zhuang &
Wu, 2013)
![]()
|
Variables |
|
|
PRv |
Human perceived risk increases with higher
risk from vehicles |
|
PRl |
Human perceived risk increases with higher
risk from local-defined risk |
|
ag |
A coefficient adjusting effect of group
size of human |
|
Ngroup |
Group size of human |
Equation Set C-11: Decision making in
lateral control: Equation (1, 2) (Bi, Gan,
Shang, & Liu, 2012)
![]()
|
Variables |
|
|
|
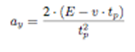
Increment of steering angle |
|
kp, kd |
The coefficients of proportional
derivative controller |
|
a'y |
The first derivative of acceleration |
|
E |
Error
between the desired lateral position gained with the predefined desired path
and predictive lateral position computed with the internal vehicle dynamics
model |
|
v |
Current
lateral velocity |
|
tp |
Preview time |
Equation Set C-12: Modeling hazard
evaluation accuracy: Equation (8, 16, 21) (
Zhang, Wu, & Wan, 2016)
![]()
![]()
|
Variables |
|
|
|
|
The effect of hazard evaluation accuracy
on error rate |
|
|
|
Perceived value of hazard |
|
|
|
Actual value of hazard |
|
|
|
Estimated distance |
|
|
|
Threshold of perceived distance |
|
|
|
Actual distance between the current
position of warning receiving vehicle |
|
|
v(t) |
Instant speed |
The instant speed (v) and acceleration
(at) at time t is modeled in [23] as follows: |
|
|
Global optic flow rate of the textured
ground surface |
φ is the global optic flow rate of the textured
ground surface, a proportion of speed as long as eye height is constant |
|
k |
Parameter |
The parameter k is quantified by the
annual mileage divided by a maximum value of annual mileage in general |
|
|
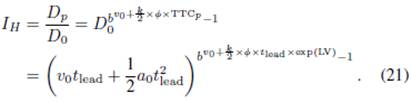
Perceived time-to-collision |
The perceived time-to-collision (TTCp)
will be affected by the existence of the lead vehicle. TTC is the actual time
to collision that the vehicle will be able to avoid a collision without
exceeding the assumed maximum deceleration |
|
LV |
Lead vehicle status |
LV is a dichotomous variable of the lead
vehicle in order to model the effect of the lead vehicle on TTCp (0 =
without lead vehicle; 1 = with lead vehicle) |
|
|
Lead time of speech warning |
-Server G:
Equation
Set C-13: Urgency and Motivation Modeling: Equation (12) (Lin &
Wu, 2012)
|
Variables |
|
|
|
|
Response time to i th stimulus with a
finger strategy under an urgency condition |
|
|
RT |
Reaction time |
|
|
DL |
Delay time caused by dual-task
interference |
|
|
MT |
Movement time |
|
|
|
Key-closure Time |
|
|
|
Finger strategy |
notation of finger
strategy. |
|
|
Urgency |
notation of urgency. |
|
i |
Response order |
notation of response
order. i=1→first
response in 9-digit number, and so on. |
Motor Subnetwork
-Server W:
Equation Set M-1: Motor program retrieval modeling
in the learning process: Equation (2) (Wu & Liu, 2008b)
![]()
|
Variables |
|
|
|
|
Processing
time in each server |
Reduction
of Server Processing Time. |
|
|
Expected
minimal processing time (Ti) at server i after intensive practice |
Feyen
(2002) |
|
|
Change
in the expected processing time from the beginning to
the end of practice |
Reduction
of Server Processing Time. |
|
|
Learning
rate of server i |
Heathcote
et al. (2000) |
|
|
Number
of entities processed by server i |
Reduction
of Server Processing Time. |
-Server X:
Equation Set M-2: Error correction modeling
in close-loop motor control: Equation (24-32) (Lin & Wu, 2012)
![]()
|
Variables |
|
|
|
|
The
uncorrected portion of endpoint variability |
Endpoint
variability in different conditions |
|
MT |
Movement
time |
Modelling
response time of numerical typing: the general equation of response time |
|
DL |
Delay
time caused by dual-task interference |
Modelling
response time of numerical typing: the general equation of response time |
|
Err% |
Estimations
of error rates |
Estimations
of error rates (Err%) in jth typing
conditions |
|
P( |
Parameters |
The probability of errors in X-direction
and Y-direction during jth experimental
condition |
-Hand Servers (Server 23, 24):
Equation
Set M-3: Hand and finger movement time and errors in QWERTY keyboard typing:
Equation (19) (Wu &
Liu, 2008b)
![]()
|
Variables |
|
|
|
Dis |
Movement distance |
Distribution of Movement Distance. |
|
M |
Population size |
Equation (19) can be used to estimate the distribution
of movement distance of different body parts including hands and fingers. |
|
RD |
Movement radius |
Equation (19) can be used to estimate the distribution
of movement distance of different body parts including hands and fingers. |
Equation
Set M-4: Bimanual
(two hands) coordination: Equation (31-34), (Wu &
Liu, 2008b)
![]()
![]()
![]()
![]()
|
Variables |
|
|
|
Y |
Time |
The time (Y) saved by optimization of EPD |
|
EPD |
Error Prevention Duration |
The optimization process of EPD is a
trade-off between the time in typing and the time in error correcting |
|
N |
Number |
The number of characters typed |
|
|
Parameter |
It specifies how long to correct one
transposition error |
|
e |
Parameter |
It refers to the error rate of the
transposition error made by reducing of EPD |
Equation
Set M-5: Hand and finger movement time and error in numerical typing: Equation
(13) (16) (Lin &
Wu, 2012)
|
Variables |
|
|
|
|
Response time to ith stimulus with a finger strategy under β urgency condition |
Modelling response time of numerical
typing: the general equation of response time |
|
|
The processing time of ith stimulus at
Server k |
All Tk are estimated based on
parameter settings in QN-MHP |
|
D |
Travel distance |
Modelling baseline response time in
numerical typing |
|
|
Effective target size |
The effective target size (Se) is
calculated based on the maximal target width that can be utilized without
touching adjacent keys: |
|
|
Constant |
Im =100 is used as it was suggested in the
original study (Card et al. 1983) |
|
|
Key-closure Time |
Modelling response time of
numerical typing: the general equation of response time |

|
Variables |
Description |
|
|
The Extent of SDN added with muscle
activation level u in the |
|
|
Muscle activation level in the |
|
|
Extent of TN in the |
|
|
Interference index |
|
|
Experimental constants |
-Foot Server
(Server 25)
Equation
Set M-6: Movement time of foot in pressing a pedal: Equation (21) (Wu &
Liu, 2008b)
![]()
|
Variables |
Description |
Sources |
|
MT |
Movement time |
The foot server executes the simulated
movement to press a pedal and its movement time ( |
|
S |
Shoe width |
S refers to the shoe width [10cm,
Armstrong 2004] |
|
W |
Pedal width |
W is the pedal width (10cm, same with the
shoe width) |
|
A |
Parameter |
A stands for the movement distance (3cm,
typical movement distance for a foot pedal). |
Equation
Set M-7: Angular speed of the foot movement without considering the human
personality as a factor of individual difference: Equation (3) (Zhao, Wu,
& Qiao, 2013)
![]()
|
Variables |
Description |
Sources |
|
|
Pedal angular velocity |
Mathematical
Model of Human operator Speed Control: Speed Adjustment |
|
A |
Constant |
Mathematical
Model of Human operator Speed Control: Speed Adjustment |
|
|
Target speed |
Mathematical
Model of Human operator Speed Control: Speed Adjustment |
|
|
Perceived speed |
Mathematical
Model of Human operator Speed Control: Speed Adjustment |
Equation
Set M-8: Angular speed of the foot movement considering the human personality
as a factor of individual difference (Zhao &
Wu, 2013)
|
Variables |
Description |
|
|
Pedal angular velocity |
|
A |
Constant |
|
|
Target speed |
|
|
Perceived speed |
|
η |
Personality index |
Equation
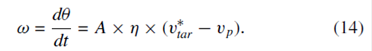
Set M-9: Effects of target speed of human on the vehicle movement speed :
Equation (6) (Zhao &
Wu, 2013)
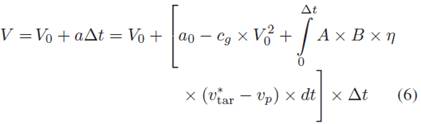
|
Variables |
Description |
Sources |
|
V |
Vehicle speed |
Mathematical Model of Human operator Speed Control: Vehicle
Mechanics |
|
|
Vehicle acceleration |
Mathematical Model of Human operator Speed Control: Vehicle
Mechanics |
|
vtar |
Target speed of a human operator |
|
|
|
Initial acceleration |
Mathematical Model of Human operator Speed Control: Vehicle
Mechanics |
|
|
Coefficient of the overall drag on the
vehicle |
Mathematical Model of Human operator Speed Control: Vehicle
Mechanics |
|
A,B |
Constants |
Mathematical Model of Driver Speed Control: Vehicle Mechanics |
5. Major Contributors and Key Users of
Mathematical Modeling of Human Performance using QN-MHP
We
specially thank Dr. Yili Liu at University of Michigan who laid the theoretical
foundation of queuing network modeling of human performance, unifying existing
reaction time models using queuing network theory.
Dr.
Changxu Wu (Group Coordinator) at University of Arizona, USA
Dr.
Robert Feyen, University of Minnesota, USA
Dr.
Omer Tsimhoni, General Motors, USA
Dr.
Ji Hyoun Lim, Apple, USA; Hongik University, Korea
Dr.
Luzheng Bi at Beijing Institute of Technology, China
Dr. Shi
Cao at University of Waterloo, Canada
Dr.
Guozhen Zhao at Chinese Academy of Sciences, China
Dr.
Cheng-Jhe (Robert) Lin, National Taiwan University of Science and Technology
Dr.
Jingyan Wan, General Motors, USA
Dr. Yiqi Zhang at Pen State University, USA
To become a member (user or contributor)
of mathematical modeling group in human performance modeling, please email to changxu.wu@gmailcom (Please list your full name
and institution/company name), we will send you recent updates, new modeling
work, and new tutorials. All of them are free.
Reference
Bi, L., Gan, G., Shang, J., & Liu, Y. (2012).
Queuing Network Modeling of Driver Lateral Control With or Without a Cognitive
Distraction Task. IEEE Transactions on Intelligent Transportation Systems,
13(4), 1810 to 1820. doi:10.1109/TITS.2012.2204255
Bi, L.,
Tsimhoni, O., & Liu, Y. (2009). Using Image-Based Metrics to Model
Pedestrian Detection Performance With Night-Vision Systems. IEEE Transactions
on Intelligent Transportation Systems, 10(1), 155 to 164.
doi:10.1109/TITS.2008.2011719
Cao, S.,
& Liu, Y. (2015). Modelling workload in cognitive and concurrent tasks with
time stress using an integrated cognitive architecture. International Journal of Human Factors Modelling and
Simulation, 5(2),
113 to 135.
Lim, J.
H., & Liu, Y. (2009). Modeling the Influences of Cyclic Top-Down and
Bottom-Up Processes for Reinforcement Learning in Eye Movements. IEEE
Transactions on Systems, Man, and Cybernetics - Part A: Systems and Humans,
39(4), 706 to 714. doi:10.1109/TSMCA.2009.2018635
Lin,
C.-J., & Wu, C. (2012). Mathematically modelling the effects of pacing,
finger strategies and urgency on numerical typing performance with queuing
network model human processor. Ergonomics, 55(10), 1180 to 204.
doi:10.1080/00140139.2012.697583
Wu, C.,
Berman, M., & Liu, Y. (2010). Optimization in Brain? - Modeling Human Behavior
and Brain Activation Patterns with Queuing Network and Reinforcement Learning
Algorithms. In W. Chaovalitwongse, P. M. Pardalos, & P. Xanthopoulos
(Eds.), Computational Neuroscience (Vol. 38, pp. 157 to 179). New York, NY:
Springer New York. doi:10.1007/978-0-387-88630-5
Wu, C.,
& Liu, Y. (2007). Queuing Network Modeling of Driver Workload and
Performance. Intelligent Transportation Systems, IEEE Transactions on, 8(3),
528 to 537.
Wu, C.,
& Liu, Y. (2008a). Queuing network modeling of the psychological refractory
period (PRP). Psychological review, 115(4), 913 to 954. doi:10.1037/a0013123
Wu, C.,
& Liu, Y. (2008b). Queuing network modeling of transcription typing. ACM
Transactions on Computer-Human Interaction, 15(1).
Wu, C.,
Liu, Y., & Quinn-Walsh, C. M. (2008). Queuing Network Modeling of a
Real-Time Psychophysiological Index of Mental Workload-P300 in Event-Related
Potential (ERP). Systems, Man and Cybernetics, Part A: Systems and Humans, IEEE
Transactions on, 38(5), 1068 to 1084.
Wu, C. (2016).
The Five Key Questions in Human Performance Modeling. International Journal of Industrial Ergonomics, Accepted.
Zhao, G.,
& Wu, C. (2013). Mathematical Modeling of Driver Speed Control With
Individual Differences. IEEE Transactions on Systems, Man, and Cybernetics:
Systems, 43(5), 1091 to 1104. doi:10.1109/TSMC.2013.2256854
Zhao, G.,
Wu, C., & Qiao, C. (2013). A Mathematical Model for the Prediction of
Speeding with its Validation. IEEE Transactions on Intelligent Transportation
Systems, 14(2), 828 to 836.
Zhang,
Y., Wu, C., & Wan, J. (2016). Mathematical Modeling of the Effects of
Speech Warning Characteristics on Human Performance and Its Application in
Transportation Cyberphysical Systems. IEEE Transactions on Intelligent
Transportation Systems, 17(11), 3062 to 3074.
Zhuang,
X., & Wu, C. (2013). Modeling Pedestrian Crossing Paths at Unmarked
Roadways. IEEE Transactions on Intelligent Transportation Systems, 14(3), 1438
to 1448.